Figure
To figure something out is to work it out. This is because figure is
a word we use for the symbols (1,2,3, etc) that we use to represent
numbers.
In a book (or a dissertation or report) a figure is a drawing or
diagram, and a table of figures is a list or the drawings and
diagrams in the book.
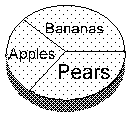
In geometry, a figure is the word used for shapes and solids. Examples of
geometrical figures are triangles, circles, squares, cones, spheres and
cubes. A geometrical figure is either a two
dimensional space enclosed by a
line (e.g. a circle) or lines (e.g. a triangle), or a three dimensional
space enclosed by a surface (e.g. a sphere) or surfaces (e.g. a cone).
To figurate is to form, fashion or shape. A figuration is
when you draw the form, shape, outline, or contour of a thing.
Figurational sociology traces the shape of society by tracing the
links between individuals to show how they fit into
networks. (See
Wikipedia
figurational sociology)
Flow Chart


 Study
links outside this site
Study
links outside this site
 Andrew Roberts' web Study Guide
 Take a Break - Read a Poem
 Click coloured words to go where you want